
Excel Dashboard Templates

Wednesday, May 21, 2008
Personal Health Metrics Dashboard
Digital dashboards are perfect for tracking Key Performance Indicators and metrics throughout the corporate world, but how about using them to track personal metrics as well? Here is a screenshot of a personal health metrics dashboard used to track weight management regimines.

Tuesday, May 13, 2008
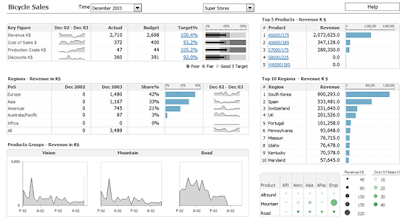
Equipment Sales Dashboard Metrics
Here is a look at an equipment sales dashboard that tracks key performance indicators and metrics for a UK-based exercise equipment dealer. Note that the focus is clearly on tracking the various financial metrics such as gross margin, sales quantity, sales value, cost of goods, and various slices by factors such as sales channel, region, product group and payment type.


Monday, May 12, 2008
News Dashboards for Tracking Sports Events
The growing popularity of digital dashboards indicates that the dashboard design pattern's efficacy extends beyond that of traditional business intelligence. We are seeing it used more and more as navigation elements and information presentation layouts.
Here are a couple of news type dashboards. Specifically, these were used to track the March Madness that occurs during the NCAA tournament.


Here are a couple of news type dashboards. Specifically, these were used to track the March Madness that occurs during the NCAA tournament.


Tuesday, May 6, 2008
Management Dashboard with Sparklines
If the idea of a BI dashboard or scorecard is to present business intelligence in as concise a manner as possible, then one absolutely must look to charts and graphs that are information-rich yet efficient in terms of screen real estate. Sparklines and bullet charts come to mind.
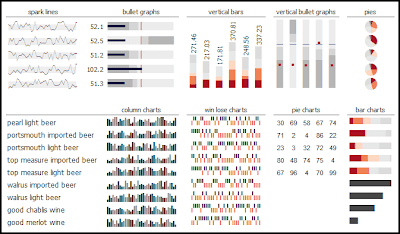
Take a look at the charting options made possible by Microcharts, a charting solution for Excel used by many business dashboard implementation teams.
Here's a good example of a management dashboard with sparklines and bullet charts.
Here are some sample charts:
There is an online demo of this Excel management dashboard.
Take a look at the charting options made possible by Microcharts, a charting solution for Excel used by many business dashboard implementation teams.
Here's a good example of a management dashboard with sparklines and bullet charts.

Here are some sample charts:

There is an online demo of this Excel management dashboard.
Subscribe to:
Posts (Atom)