Excel Dashboard Templates

Learn how to create Excel dashboards.

Thursday, June 21, 2007

PGA Executive Dashboard for Media Convergence

Executive dashboards replacing TV? The idea of watching a sports event on the web instead of on television has been kicked around for a long time. The rationale is that the web can offer interactivity and drill down capabilitiy that the TV set just can't (forget about the age-old pursuit of interactive TV - it's like looking for the fountain of youth!). Now with the widespread adoption of digital dashboards, it looks like it is now ready for prime time.

Well, in today's Executive Dashboard post, here is a dashboard screenshot taken while some avid golf enthusiast was watching a PGA tournament online. It comes from this post at skye journal. It has a skype conferencing window on the left so that he can chat with fellow fans (the ultimate live color commentary), a golf tournament dashboard provided by pga.com in the middle and a slingbox video feed on the right.

Note that in this paradigm, the actual video is all the way on the right. What is more important is the interaction with fellow fans and monitoring relevant KPIs, metrics and statistics via the golfing dashboard. Is this the future of television? Will people be dialing it to their executive dashboards?
Here is the executive dashboard screenshot. Click on the dashboard to enlarge the image.

Tags: Interactive dashboard, executive dashboards, enterprise dashboards, golf dashboard

Friday, June 8, 2007

Executive Dashboard Project Sponsor Wants a Bigger Logo?

"Don't want to tell you how to do your job, but make the logo bigger. Make the logo as big as you can." Sounds familiar right? We've all been on projects where we get design advice. How to handle this?

Over at the enteprise-dashboard.com collection of executive dashboard screenshots, there is a pointer to a hillarious graphic design song (bet you didn't know that was a genre of music!) called Make the Logo Big.

The direct url to the song is

http://www.underconsideration.com/MaketheLogoBigger.mp3

You can read more about it at http://www.enterprise-dashboard.com/2007/06/08/make-the-logo-bigger-please/

Tuesday, June 5, 2007

Executive Dashboard for Sales Representative Metrics

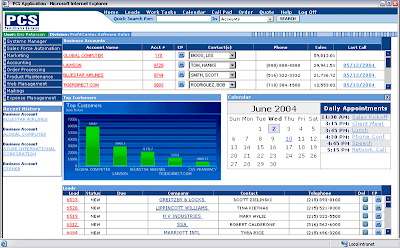
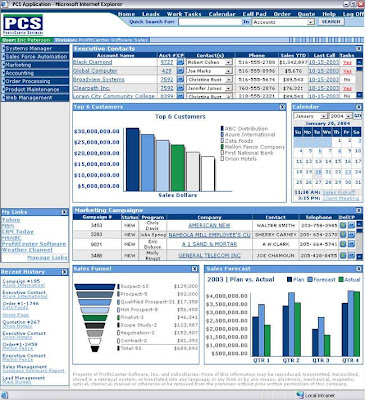
Today's executive dashboard screenshots serve sales representatives and sales executives by providing role-based display of metrics and KPIs critical for monitoring the company's marketing and sales activities. The enterprise dashboards are composed of portlets or widgets that contain content in the categories of financials, marketing activities, sales force automation (SFA) and standard portal functionality (calendar, links, history, etc.)

This first business intelligence dashboard shows the content that a sales representative receives upon loggin in to the application. The view is quite SFA-centric, with the list of accounts, contact information, top customers chart, calendar and contact information right at the top of the fold. The lead stage contact information is shown along with each lead's status information.


This next executive dashboard is for the business user role of sales manager. Note that in addition to the metrics and kpis available to the sales representative, the sales manager also sees sales cycle metrics and marketing campaign status.


Remember to click on the screenshots above to examine these executive dashboards in detail.

Tags: Executive Dashboards, Sales Dashboard, Marketing Dashboard